Interactive Geospatial Mapping Solutions for global impact.
Gisomni designs, deploys, and manages geospatial platforms for impact-driven communities —
NGOs, government agencies, and social enterprises navigating volatile, complex environments.
Organizations can't see the full landscape of available resources — leading to duplicated effort and missed collaboration.
Resource Mapping
Visualise every resource, organisation, and initiative on an interactive geospatial globe — search, filter, and connect instantly.
02
Engagement Measurement
Traditional platforms fail to capture real-time community activity, participation patterns, or stakeholder engagement.
Community Interaction
Direct, real-time engagement tools — activity feeds, discussion features, event announcements, and live community profiles.
03
Decision-Making in the Dark
Without comprehensive analytics, strategic decisions in multi-stakeholder environments are made blind.
Actionable Insights
Live dashboards, trend analysis, and AI-driven community health metrics that transform complex data into confident decisions.
OUR SOLUTIONS
Explore some of the solutions we have worked on.
01Platform
Omni Net
Full-spectrum geospatial platform — resource mapping, real-time community interaction, AI analytics, and forensic intelligence. Built for organisations navigating volatile, complex environments.
CommunityPosting · Direct Messaging · Affiliate Posting
IntelligenceAI Chat · AI Analytics · Custom Analytics
ManagementUser Dashboard · Admin Dashboard
Partners
SpringBoard EventsImpact Verse
02Research Tool
Kosmopulse
Geospatial search engine mapping global media narratives across time and location — advanced NLP, 3D WebGL visualisation, and enterprise Kubernetes infrastructure.
IngestionWeb Scraping · 20+ Outlets · Live & Historical
Smartphone land area measurement via sensor fusion — combines Pedestrian Dead Reckoning and GPS to deliver 1–8% area accuracy for farmers, surveyors, and field workers, even under canopy.
UXMetronome Pacing · 3D Path Viewer · Offline-first
News & Insights
From the Field
12 Feb 2026Product
Omni Tracker — 1–8% land area accuracy from a smartphone, no specialist equipment required
Sensor fusion of Pedestrian Dead Reckoning and GPS delivers reliable field measurements offline, under canopy, and anywhere GPS alone produces 20–30% error. Built for farmers, surveyors, and field workers.
28 Jan 2026Event
Honoured to present to PATNuC — Cameroon's $100M World Bank digital transformation initiative
The conversation centred on how real-time geospatial intelligence can fundamentally shift agri value food chain analysis — mapping assets, stakeholders, production nodes, and supply flows in one connected, living view.
A full-spectrum geospatial platform built for impact-driven communities — NGOs, government agencies, and social enterprises navigating volatile, complex environments. Every capability needed to map, engage, analyse, and manage — deployed as one system.
Geospatial
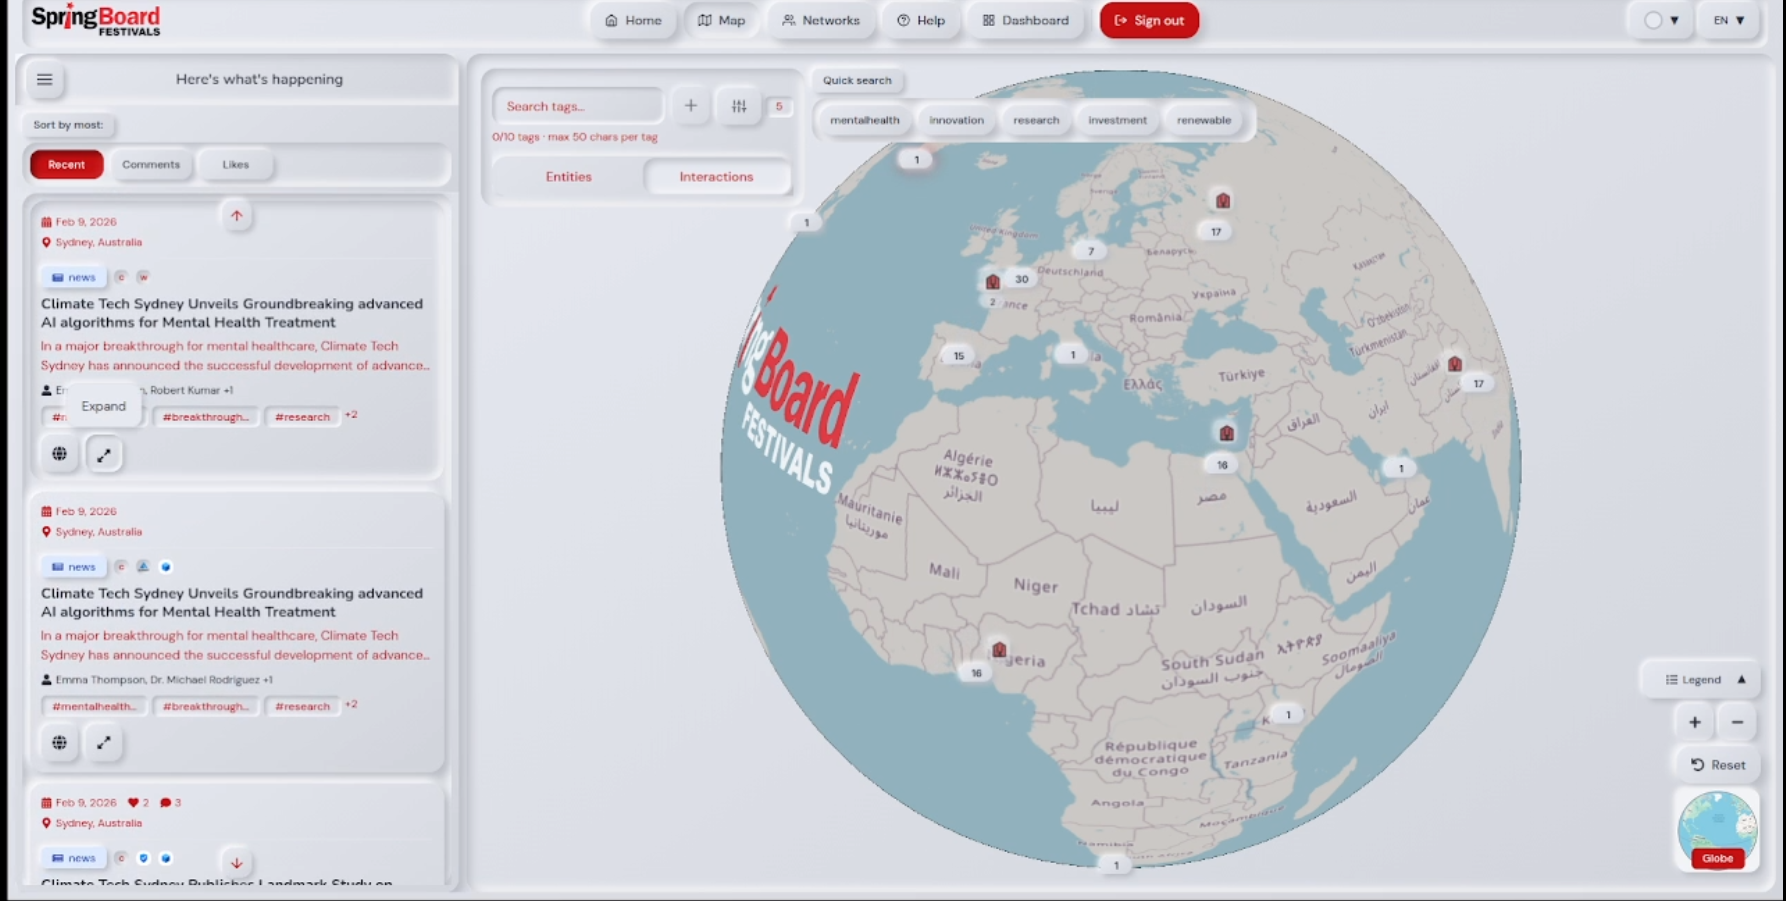
An interactive 3D GIS globe for visualising resources, organisations, and activity in geographic context. Resource mapping catalogs every entity with location, focus area, and profile. Network visualisation reveals connections and collaboration patterns between community members.
Community
Posting tools let members share discoveries, events, and news in real time. Direct messaging enables private communication across the network. Affiliate posting allows organisations to issue shareable codes so community members can contribute activity on their behalf.
Intelligence
An embedded AI chat assistant for querying community data conversationally. AI analytics surface patterns, trends, and engagement predictions automatically. Custom analytics let each deployment define the metrics that matter most to their community.
Management
A user dashboard gives every member visibility into their own activity, connections, and contributions. The admin dashboard provides full community oversight — moderation, configuration, user management, and reporting — for platform managers and administrators.
SpringBoard Festivals and its community turning scattered efforts into coordinated action. The platform maps artists, bands, and music licensing connections across a thriving community — real-time visibility into who's doing what, where, and with whom. A music revolution, built on geospatial infrastructure.
Bringing catalytic impact organisations together to find, understand, and collaborate across the social impact space. Interactive 3D resource mapping, real-time community engagement, and AI-powered community health analytics — enabling NGOs and social enterprises to coordinate action and amplify collective impact.
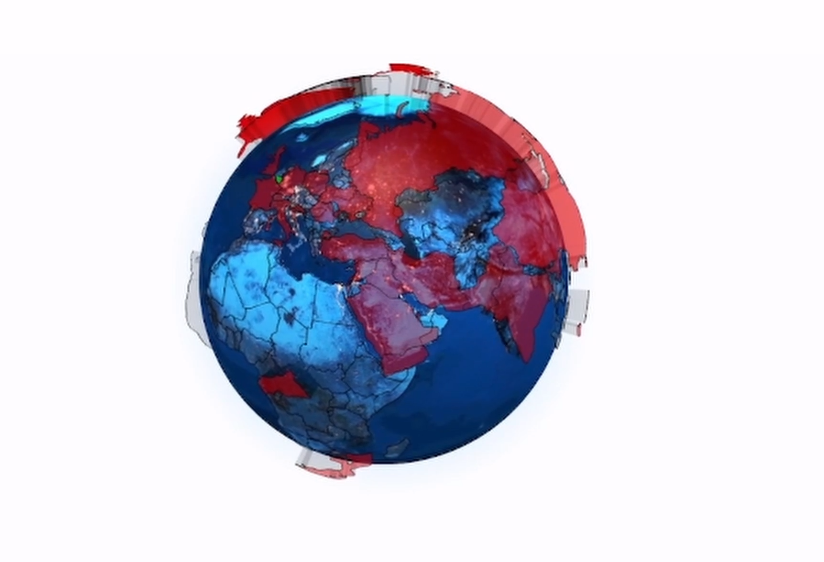
A geospatial search engine for mapping global media narratives across time and location. Every article ingested, enriched, and placed on a living map — surfacing how stories, people, and places connect across 20+ global news outlets and a corpus of over 1,000,000 records, updated continuously from live feeds.
Geospatial Search
An interactive 3D globe renders the world's media landscape in real time — raised polygons, animated arcs, and geographic clustering reveal how narratives move across borders. Timeline filters, source mapping, and tag-based search let researchers trace the evolution of political, economic, and social topics across any geography and timeframe.
NLP Pipeline
Every article passes through a deep NLP stack — spaCy, BERT, GPT, and a custom Graph Neural Network — automatically extracting named entities, keywords, and geographic references. People and places are tagged, linked, and cross-referenced across the entire corpus, enabling precise narrative tracing and relationship discovery at scale.
Data at Scale
A continuously growing corpus of 1,000,000+ enriched articles drawn from 20+ major global outlets. Custom scrapers run against live and historical feeds — each record enriched with entities, locations, and metadata before being indexed in a full-text PostgreSQL search engine. Every story queryable, traceable, and linkable.
Infrastructure
Runs on a multi-cluster Kubernetes environment with Calico networking, WireGuard encryption, and containerised workloads — GCP analytics as the data backbone. Designed for continuous availability and horizontal scale. An analytics module featuring trend detection, clout graphs, and sentiment timelines is in development, with a public API for researchers and developers on the roadmap.
A smartphone tool for accurate land area measurement without specialist equipment. Omni Tracker fuses two independent positioning systems — Pedestrian Dead Reckoning and GPS — to deliver 1–8% area accuracy across diverse environments. Works fully offline, under tree canopy, in valleys, and anywhere GPS alone produces 20–30% error.
Sensor Fusion
PDR acts as the primary engine — GPS as an opportunistic enhancer. Only GPS fixes with self-reported accuracy below 8 m are accepted as anchor points. A proprietary multi-anchor alignment algorithm, weighted by GPS confidence, corrects PDR drift continuously. When GPS is poor, PDR carries on undisturbed.
Pedestrian Dead Reckoning
The phone's accelerometer, gyroscope, and magnetometer track position step-by-step with no external signal. Each step's length and direction are measured, building a continuous path that works indoors, under dense canopy, in valleys, and anywhere satellites can't reach. A one-time calibration walk sets personal step length for accuracy.
Results & Visualisation
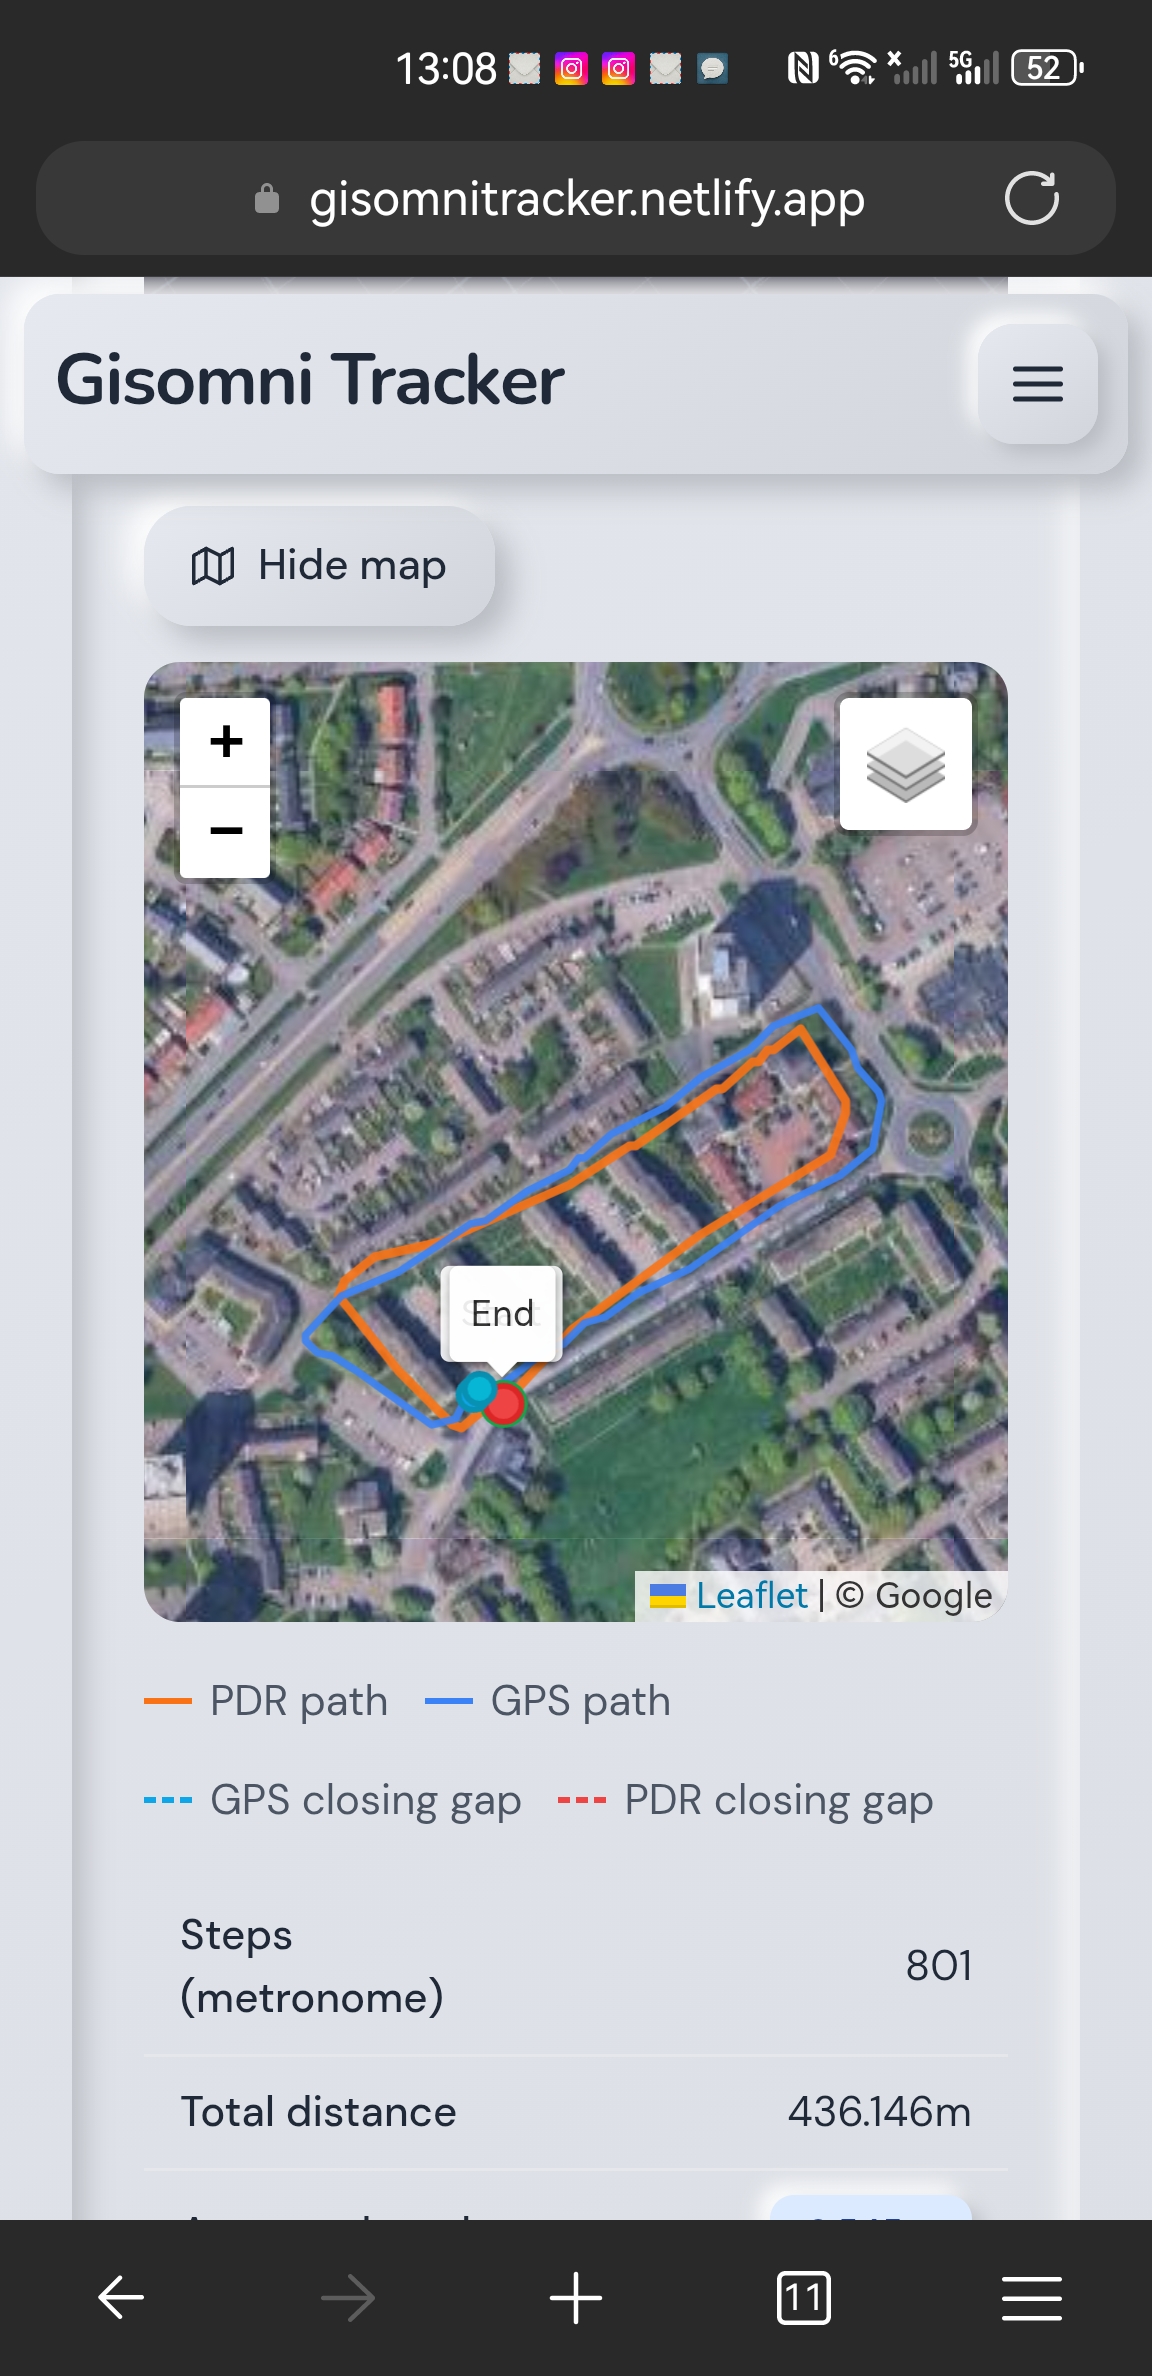
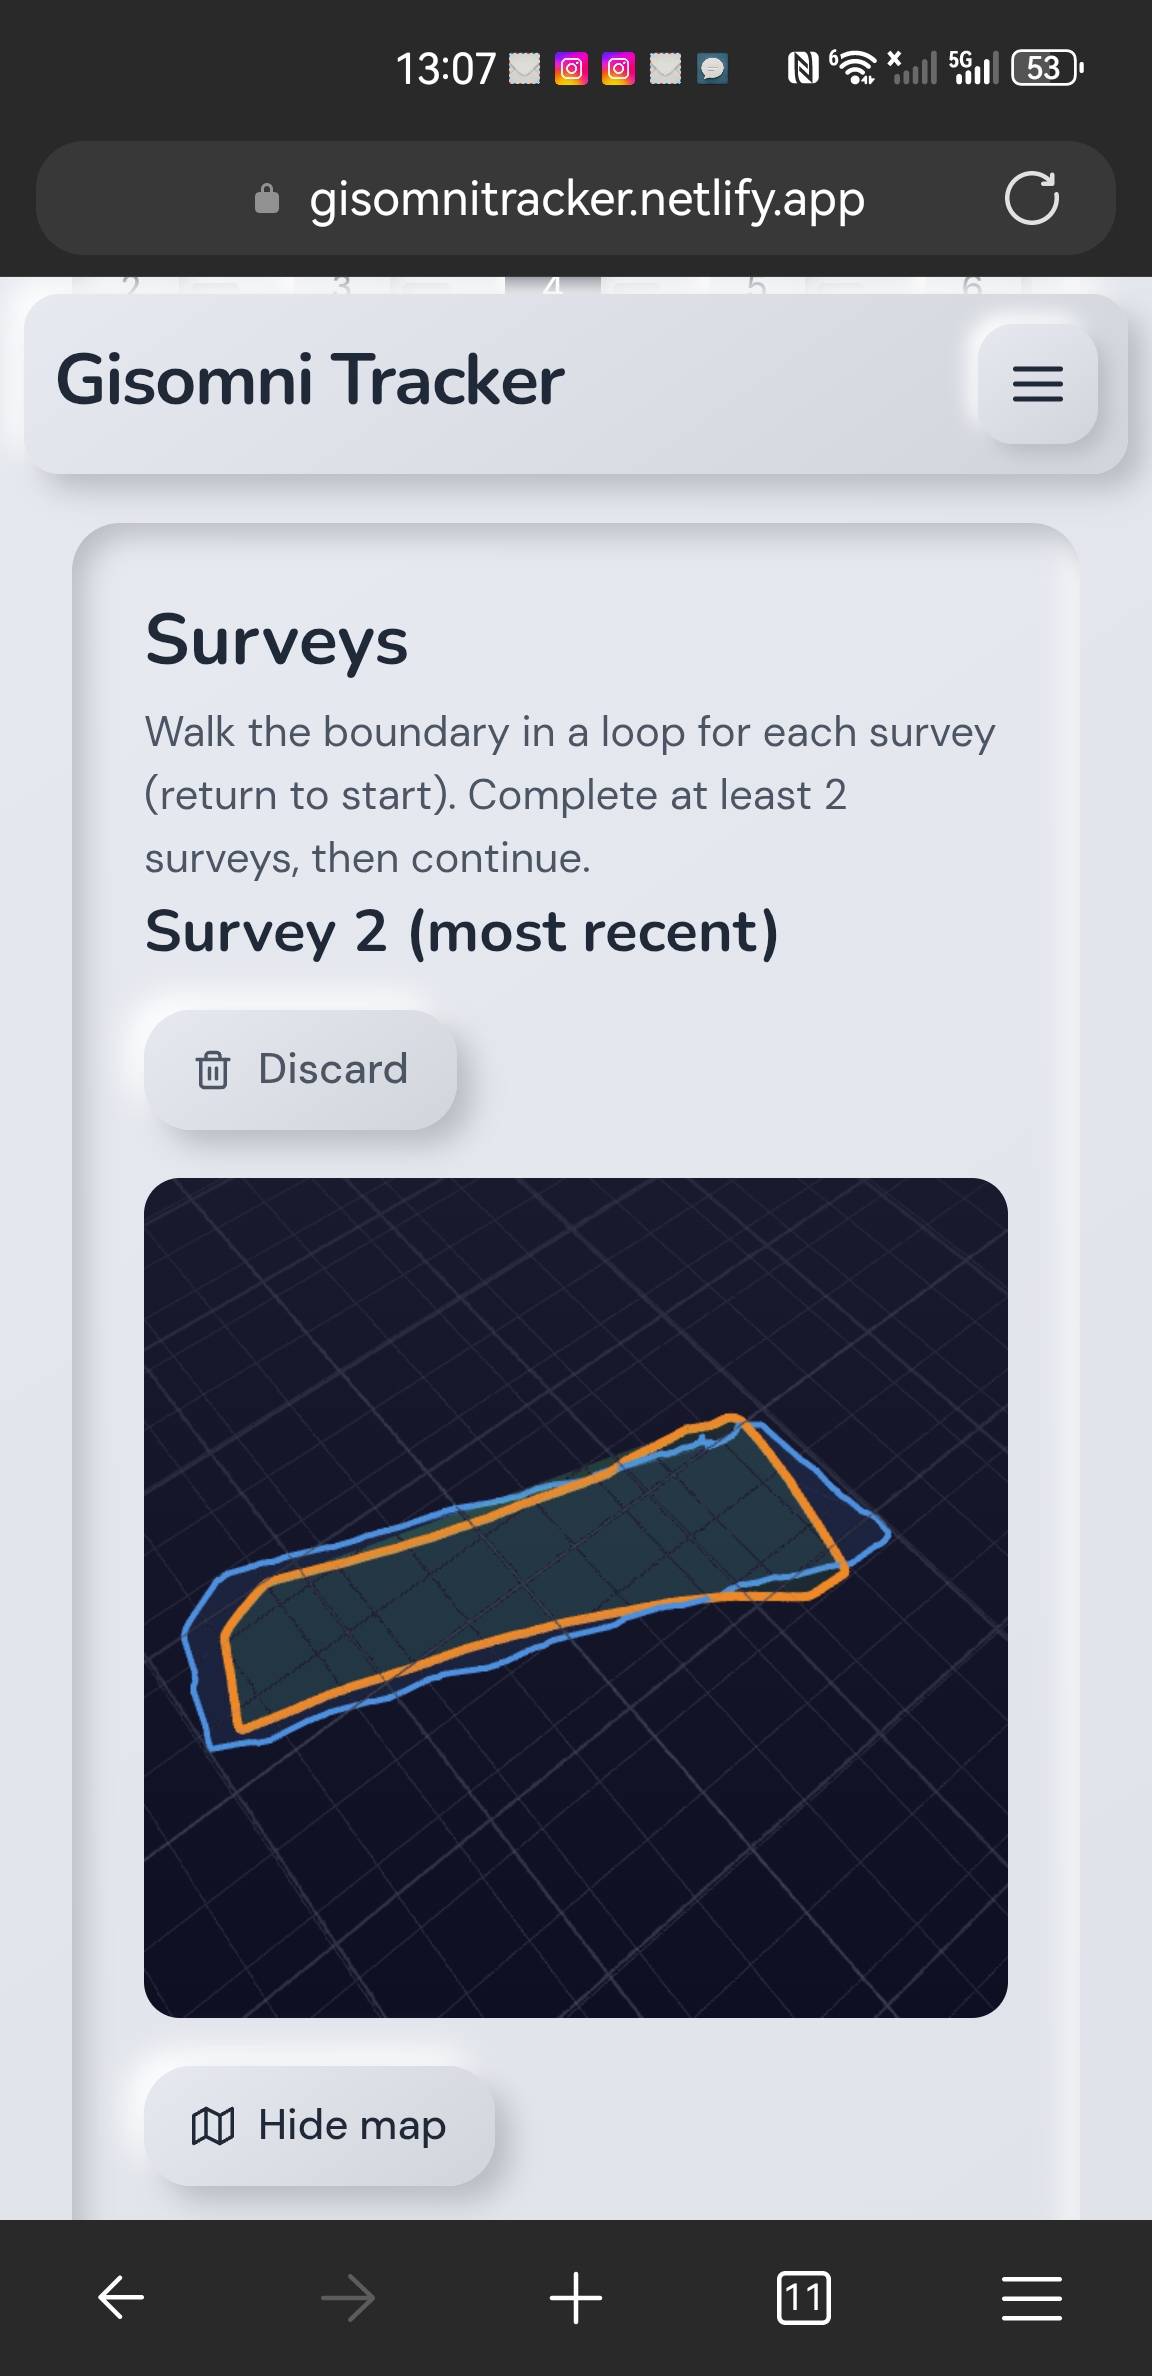
An interactive 3D path viewer renders both the PDR path (orange) and GPS track (blue) after each survey. A Google satellite overlay maps the PDR path onto a real-world reference frame. Area, perimeter, closing error, and confidence metrics are computed instantly. A second walk can be averaged for higher accuracy.
Field UX
A metronome — audio beat and visual left/right indicator — guides consistent walking pace during data capture. Sensor verification confirms all required hardware is functional before a survey begins. Fully offline-first: no network, satellite signal, or infrastructure dependency required beyond the phone in the user's pocket.
App Screenshots
1–8%Area accuracy
OfflineNo network needed
PDR + GPSDual-system fusion
Any phoneStandard sensors
Product · 12 Feb 2026
Omni Tracker — Accurate Land Measurement From Any Smartphone
We've reached a significant milestone with Omni Tracker — a smartphone tool that delivers 1–8% land area accuracy without specialist equipment, external infrastructure, or a network connection.
The core insight: GPS alone isn't good enough in the field. Under tree canopy, in valleys, or on complex terrain, GPS error climbs to 20–30%. Omni Tracker solves this with sensor fusion — combining Pedestrian Dead Reckoning (PDR) with GPS as an opportunistic anchor. The phone's accelerometer, gyroscope, and magnetometer track position step-by-step. Only GPS fixes with self-reported accuracy below 8 m are accepted. A proprietary multi-anchor alignment algorithm corrects PDR drift continuously — so when GPS is poor, PDR carries the measurement undisturbed.
The result is a fully offline-first tool that works anywhere a person can walk. A metronome guides consistent pace during data capture. After each survey, an interactive 3D viewer renders the PDR path (orange) and GPS track (blue) against a satellite overlay — giving the user an instant visual confidence check before saving.
Area, perimeter, closing error, and confidence metrics are computed on-device. A second walk can be averaged for higher precision. No specialist hardware, no connectivity, no licensing costs — just a standard smartphone and a calibration walk.
Built for farmers, surveyors, agricultural extension workers, and anyone operating where satellite coverage alone isn't sufficient. The broader goal: democratise accurate land measurement and put it in the hands of every field worker on the planet.
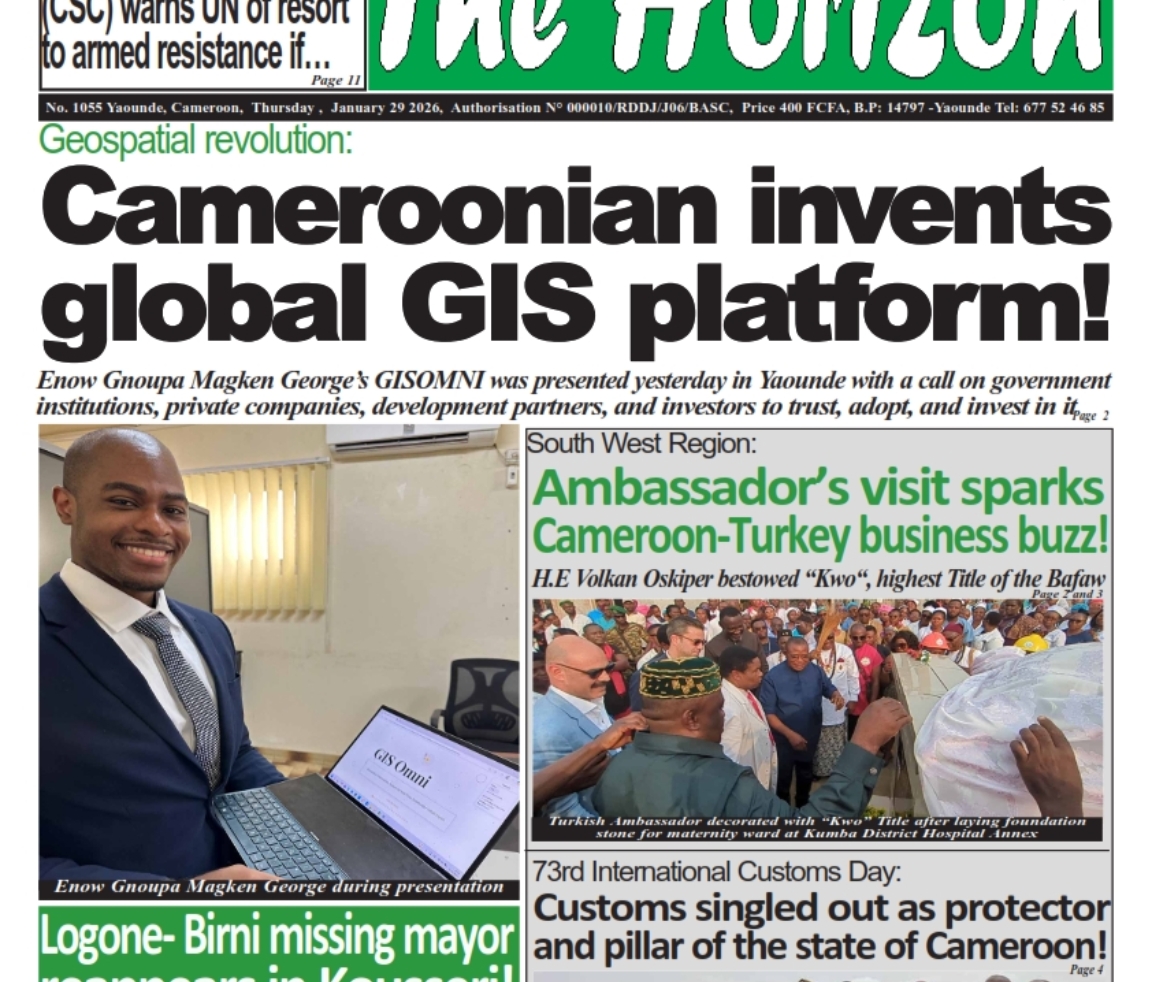
Presenting to PATNuC — Cameroon's $100M Digital Transformation Initiative
Honoured to have presented to PATNuC — the Projet d'Accélération de la Transformation Numérique au Cameroun — a $100 million World Bank-backed initiative driving Cameroon's digital transformation across key sectors, including agriculture and food systems.
The conversation centred on how real-time geospatial intelligence can fundamentally shift how we approach agri value food chain analysis — mapping assets, stakeholders, production nodes and supply flows in one connected, living view.
Agriculture operates in a VUCA world. Volatile inputs, uncertain markets, complex logistics, ambiguous ownership across the chain. The result? Decisions made on incomplete pictures, resources misallocated, and opportunities missed between the farm gate and the end consumer.
GIS Omni addresses this head-on — giving decision-makers a dynamic, collaborative platform where every stakeholder in the value chain has visibility, voice and data. Not just a map. A shared intelligence layer that bridges the gap between raw field data and boardroom strategy.
In the context of PATNuC's mandate — digitising Cameroon's economy and delivering on Vision 2035 — the alignment couldn't be clearer. Geospatial data infrastructure is not a nice-to-have. It is foundational.
The questions were sharp, the energy was real, and the work ahead is meaningful.
To the PATNuC team — thank you. This is just the beginning.
.jpg)